Visualization catalog
Every picture crucible draws lives in crucible.report. They all speak the one
schema — a TradeLog of returns in R (risk multiples), no
capital, position sizing, or equity curve — so a panel reads the edge, not an
account. Each is a plain function that returns a self-contained HTML string, so
you drop it into any page.
How to read this page
- Signature — the call. Every panel takes the
TradeLog(or, for a couple, precomputed inputs) and returns HTML. - Needs — the optional columns the panel reads. A panel with nothing to
draw returns
''rather than erroring, so a bare log degrades gracefully. include_plotlyjs— how the plotly library ships with a chart:False(default) links it from a CDN,Trueinlines it (~3.5 MB, fully self-contained),"bare"emits a script-less<div>for a page that already loads plotly once (CSP-safe embedding).
The figures below are generated by docs/gen_figures.py from the tutorial's
Donchian run, so they never drift from real output.
The whole page
Two calls assemble everything else into one document.
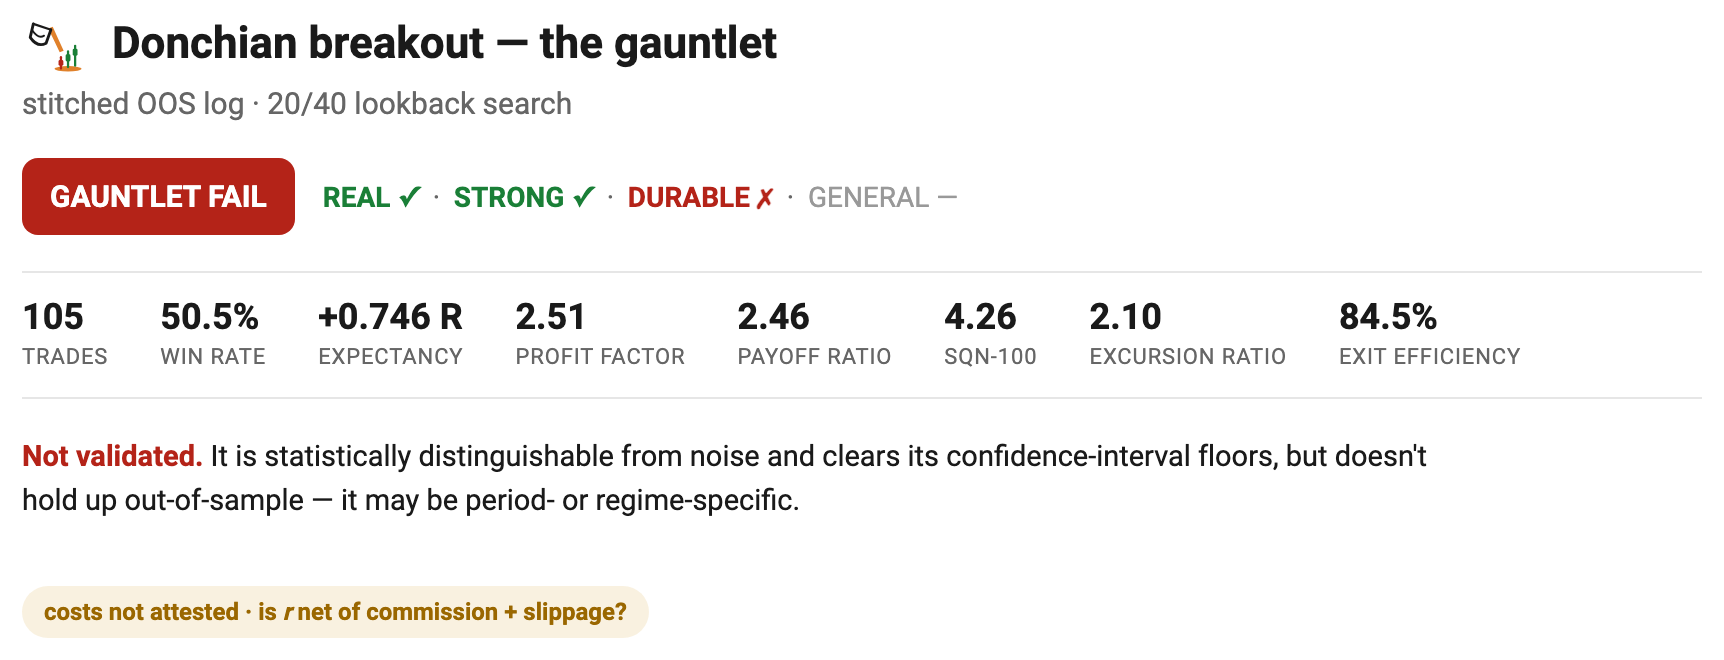
tearsheet
The one-call, self-contained page for a single book: the reality-check verdict (HELD / FRAGILE / FAIL), the metric strip, and the edge panels — written to a file.
from crucible.report import tearsheet
tearsheet(trades, "book.html", title="My strategy", subtitle="OOS log")
gauntlet_report
The gauntlet-organized page — REAL / STRONG / DURABLE / GENERAL — that a host app extends with its own panels. See The gauntlet for the design.
from crucible.report import gauntlet_report
gauntlet_report(gauntlet, trades, "gauntlet.html", title="My strategy")
Panels
Each panel stands alone. Compose the ones you want, or let tearsheet /
gauntlet_report lay them out for you.
metrics_table
The capital-free headline strip — trades, win rate, expectancy, profit factor, SQN-100, and (when excursions are present) exit efficiency — as one row of tiles.

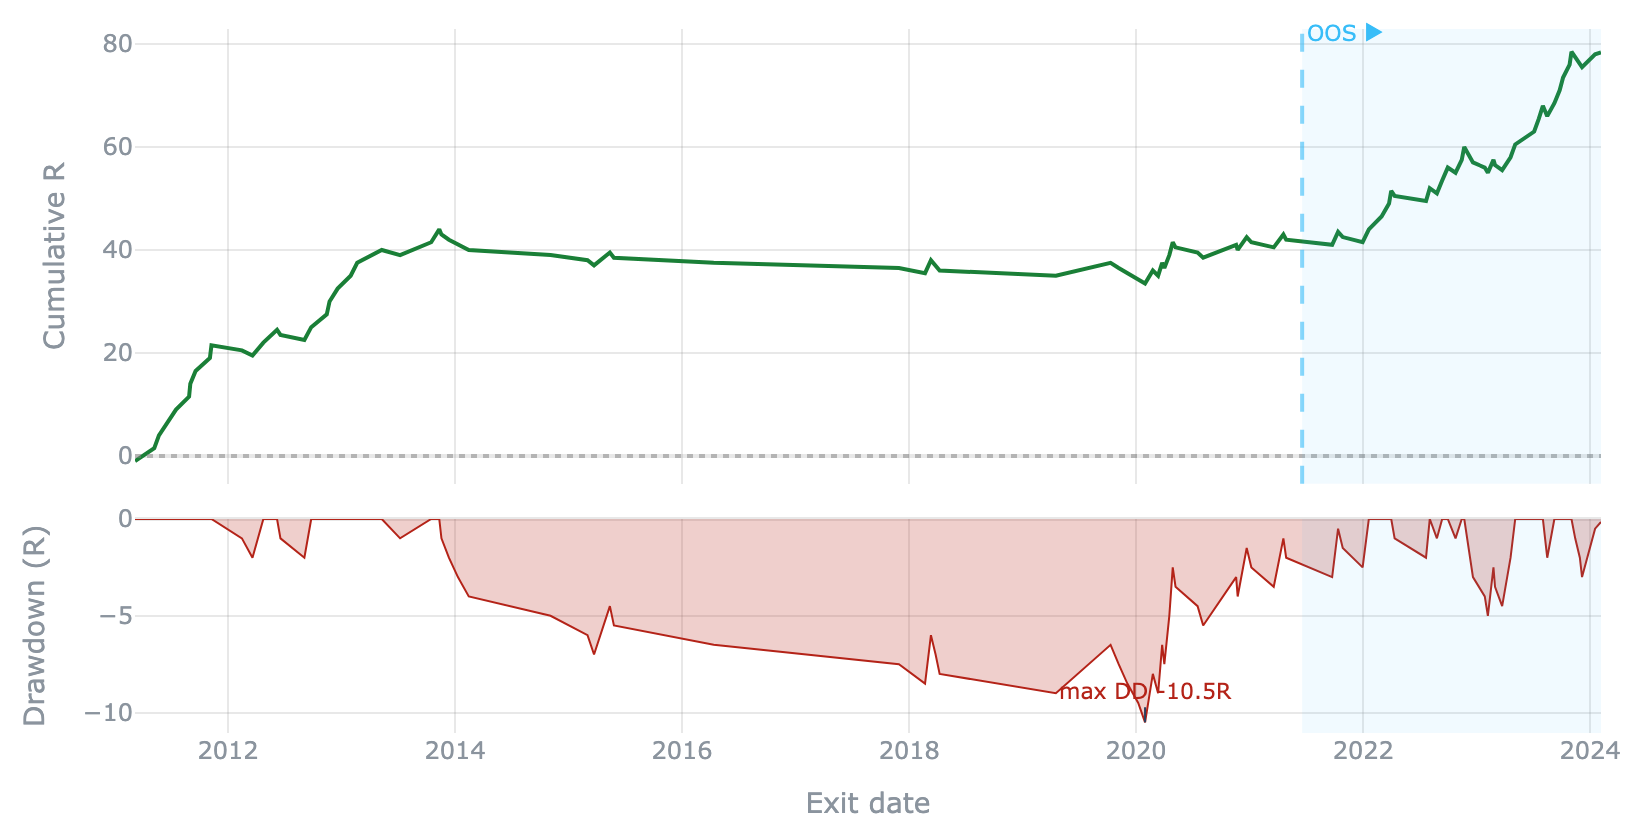
equity_drawdown
Cumulative-R curve (equal risk per trade) over an underwater drawdown panel, with
the max drawdown marked. Pass test_start to shade the out-of-sample span.
Needs: entry_date / exit_date for the time axis.
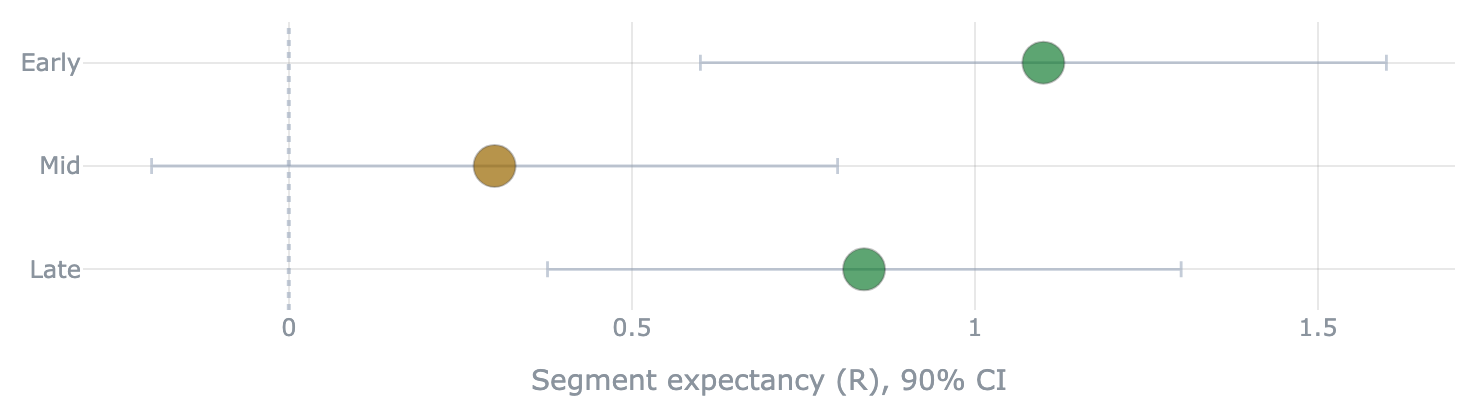
segment_forest
A forest plot of per-segment expectancy — one CI whisker per row, colored by verdict, marker size scaling with √n. The generic form of a per-class expectancy table; rows whose whisker clears the dotted zero line carry the edge.
# a {label: TradeLog} mapping, a single TradeLog + by="column",
# or precomputed {e, ci_low, ci_high, n} stats so the picture matches your tables
segment_forest({"Early": tl_a, "Mid": tl_b, "Late": tl_c})
Pairs with segmented_holdout — feed its per-segment stats
to draw the forest against the very same numbers.
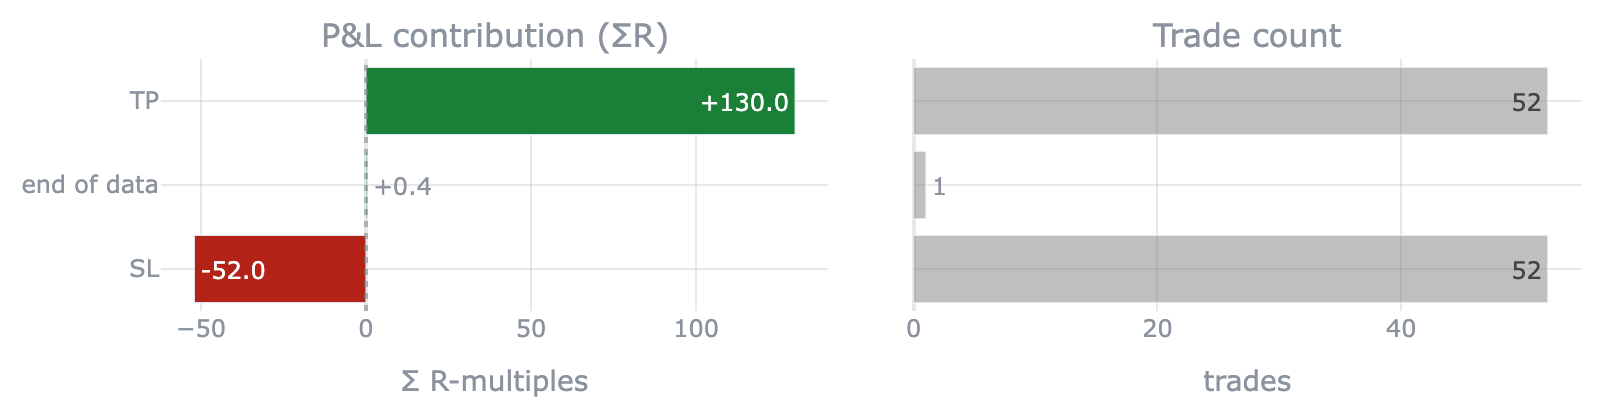
exit_reason_breakdown
Per-exit-reason attribution: for each reason (tp / stop / timeout / …), how many trades and how much total R — where the book's edge actually comes from.
Needs: an exit_reason column (a barrier / rules simulator emits it).
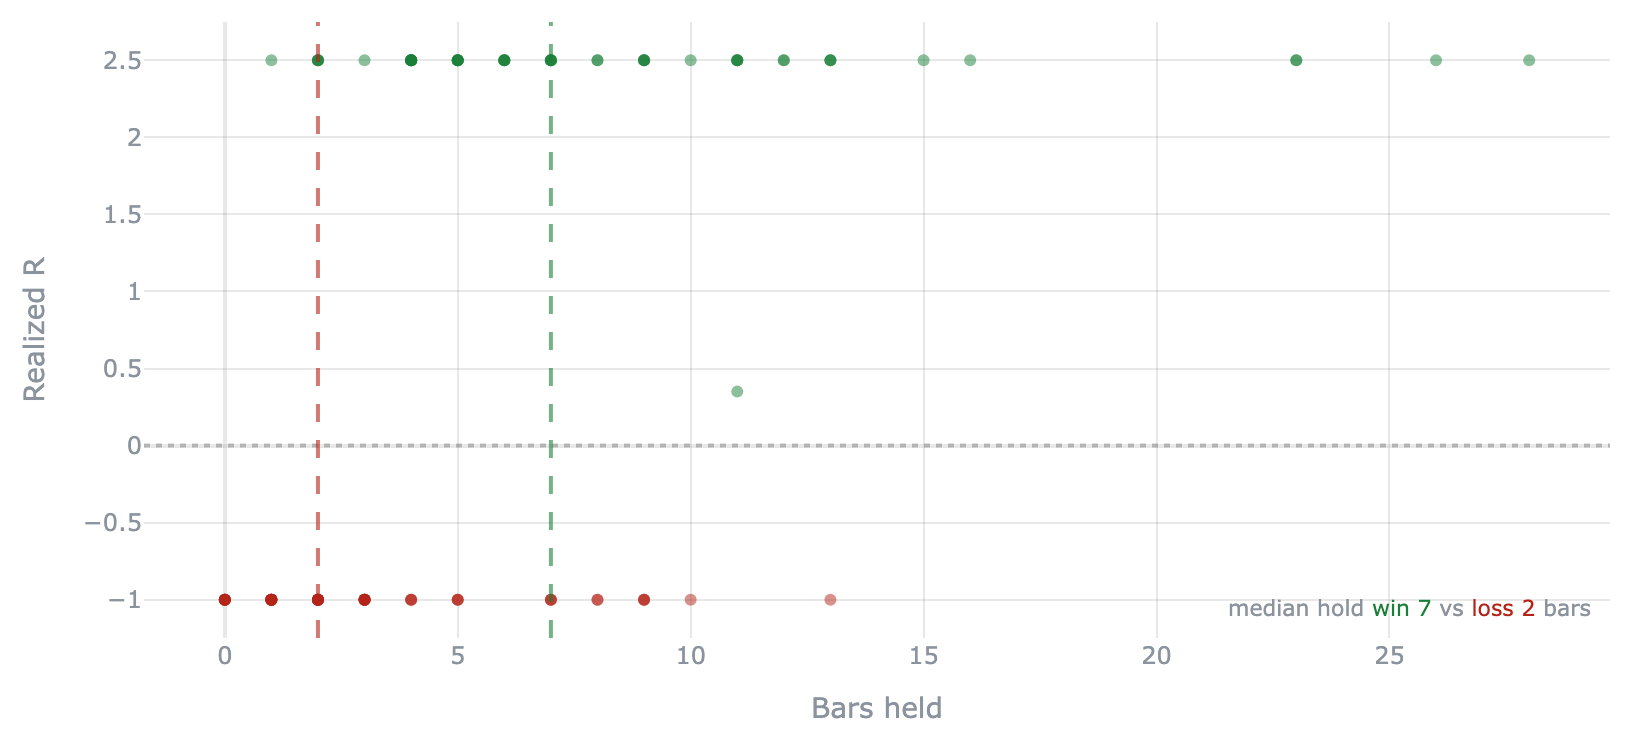
holding_vs_r
Scatter of realized R against bars held, colored win/loss, with each side's median hold — does the edge come from letting winners run or cutting losers fast?
Needs: a bars_held column.
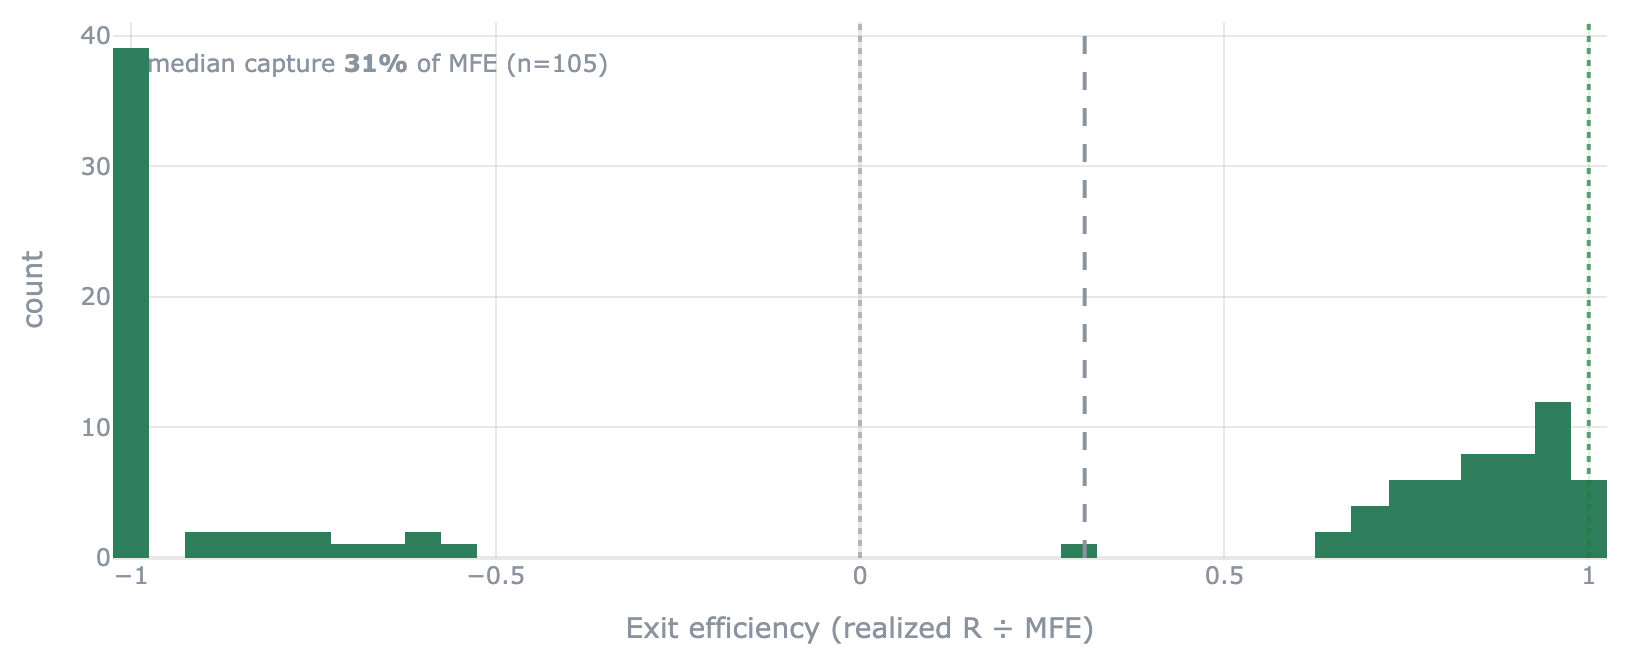
exit_efficiency_dist
Distribution of exit efficiency (realized R ÷ MFE, clipped to [-1, 1]) — how much of each trade's favorable excursion the exit rule actually captured.
Needs: an mfe (max favorable excursion) column.
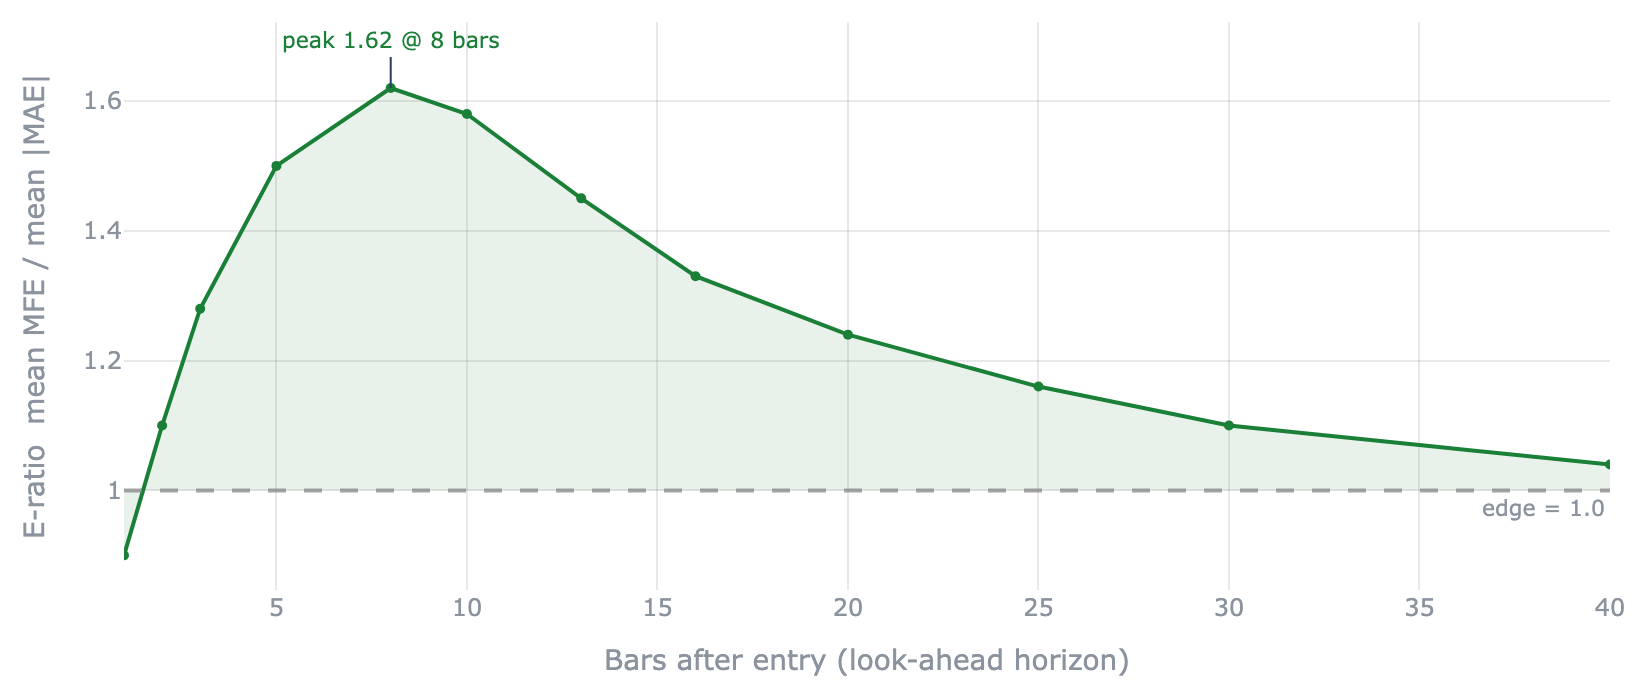
edge_ratio_curve
The exit-independent Edge-Ratio (mean MFE / mean |MAE| over a fixed k bars from each entry) versus the look-ahead horizon k, with the peak marked — the horizon where the raw entry signal is strongest, before any exit rule.
# takes the precomputed per-horizon curve (it needs per-bar excursion paths,
# not the closed-trade scalars a TradeLog carries)
edge_ratio_curve(horizons, eratio)
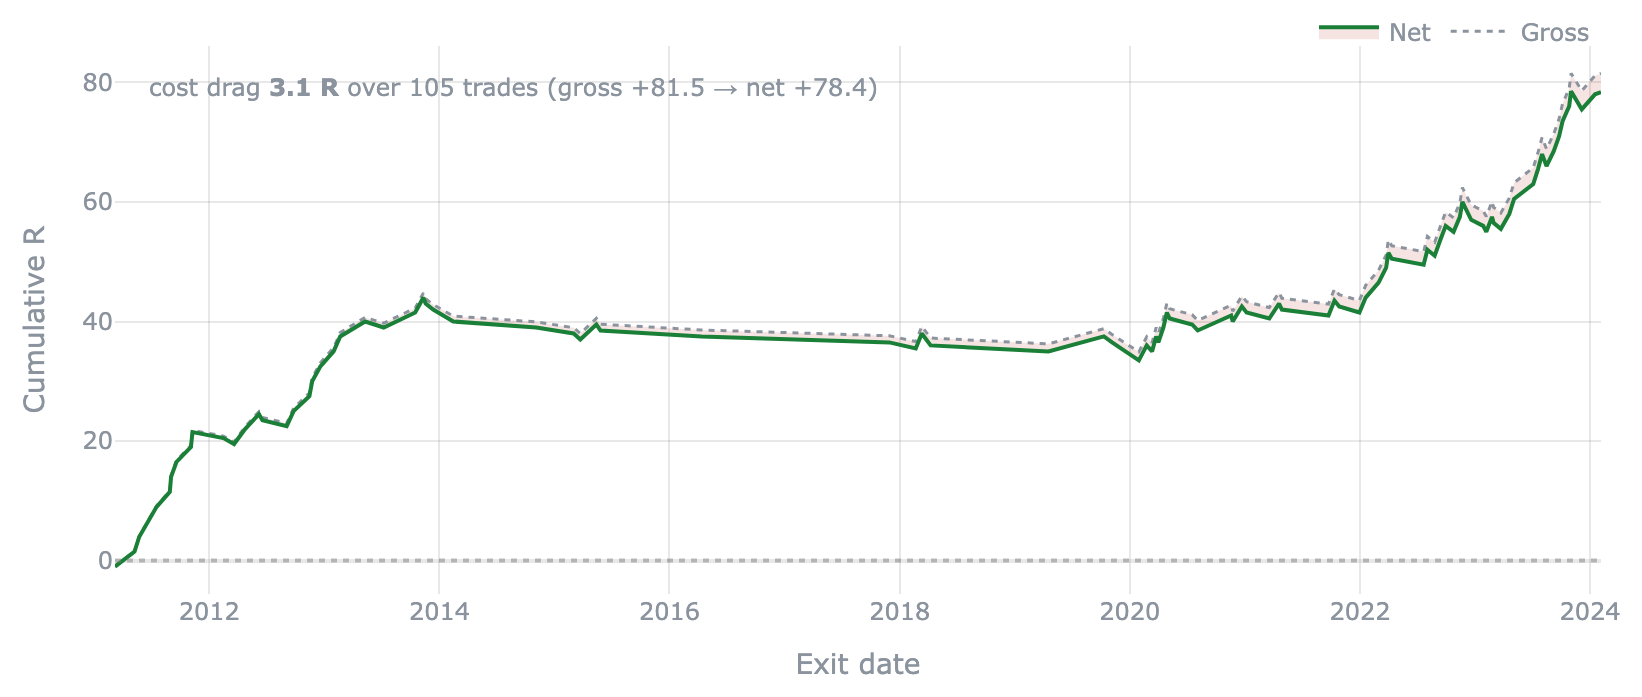
gross_net_equity
Gross versus net cumulative R with the cost-drag haircut annotated — how much of the edge transaction costs eat.
Needs: a per-trade cost series in R (passed, or a cost / cost_r column).
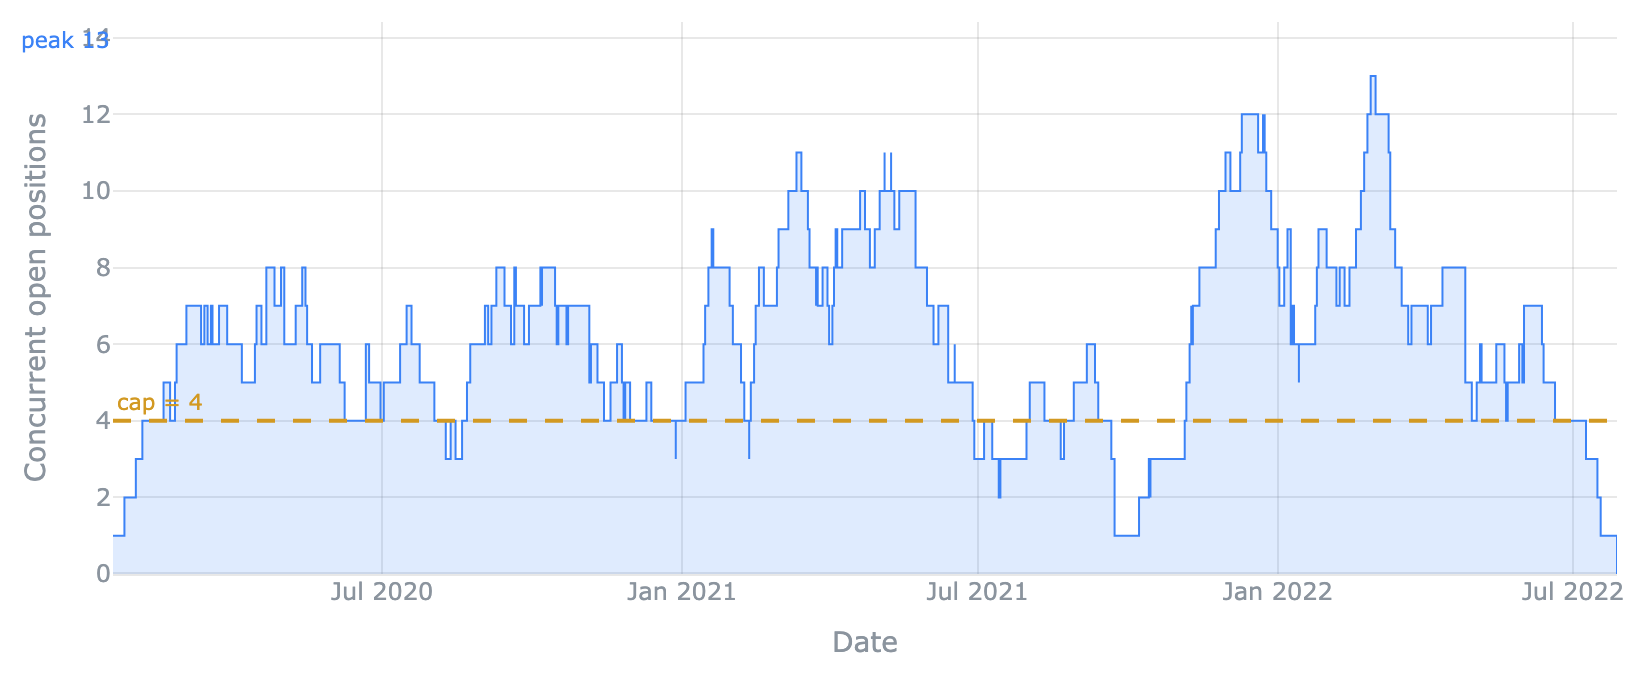
concurrency_timeline
Concurrent open positions over time, built from entry/exit events, with the peak
marked and an optional cap reference line — the cross-position concurrency that
drives a book's drawdown.
Needs: entry_date / exit_date.
Composable blocks
The pieces tearsheet and gauntlet_report are built from — reach for these when
you assemble a page yourself. They return HTML fragments (no charts of their own
beyond what's shown above).
| Function | What it renders |
|---|---|
verdict_banner(gauntlet, …) |
The HELD / FRAGILE / FAIL (or scope-limited) headline banner |
verdict_summary(gauntlet) |
The plain-English reading of the verdict |
pillar_bullets(gauntlet) |
One headline check per gauntlet pillar that ran |
gate_block(gate) |
A single gauntlet gate as an expandable block with per-check bullets |
edge_panels(trades, …) |
The default bundle of edge panels in one call |
metrics_table(trades) |
The metric strip (shown above) |
title_lockup(title, …) |
The crucible mark + title header |
report_css() |
The shared, theme-aware stylesheet — include once |
Theme-aware by default
Every block is styled for light and dark: it follows the viewer's
prefers-color-scheme, and a host that stamps data-theme="light"|"dark" on a
wrapping element overrides it. Charts are drawn theme-neutral (transparent
background, muted gridlines) so they read on either surface.