Run modes
crucible judges the same trade log at several levels of strictness. The cheapest mode reads the whole history and asks only "is there an edge, or is this noise?" The strictest runs the full gauntlet and asks "is it real, strong, durable, and general enough to fund?" Each mode is a higher bar — a genuine edge clears them all, and a fragile one drops out at the level that matches its flaw. That where is the diagnosis.
crucible is a library, so the "command" for each mode is the call. (An application built
on it — like a rules-strategy runner — typically wires these to CLI flags, e.g. a
whole-history fullrange vs an early/late holdout.)
| Mode | The question it answers | The call | Visualization |
|---|---|---|---|
| Full sample | Is there an edge at all, or small-sample noise? | full_sample |
tearsheet |
| Holdout | Does it survive an early-train / late-confirm split? | holdout |
equity_drawdown (OOS-shaded) |
| By segment | Which slices hold — and when — not just the pool? | segmented_holdout · windowed_segments |
segment_forest |
| Walk-forward | Does it survive being re-fit over rolling windows? | walk_forward |
feeds the gauntlet's DURABLE gate |
| Gauntlet | Real, strong, durable, general — the deployable verdict? | run_gauntlet |
gauntlet_report |
All of them read a TradeLog in R — capital-free. The examples
below run one book through the ladder: a Donchian channel breakout (long when price
closes above the prior 20-bar high; exit on a 2.5R target, a 1R stop, or a 30-bar cap),
on the reproducible synthetic prices in
examples/donchian_gauntlet.py.
from crucible.edge import barrier_trades
from crucible.validation import (
    full_sample, holdout, segmented_holdout, windowed_segments,
    walk_forward, run_gauntlet)

entries = donchian(px, lookback=20)                              # your signal
trades  = barrier_trades(px, entries, side="long", tp=2.5, sl=1.0, timeout=30)
Full sample
The cheapest read: the whole trade log at once. Ask the bootstrap whether the expectancy is distinguishable from zero. Names the fullrange run mode; it is in-sample — a positive verdict here means an edge exists somewhere in this history, not that it holds up going forward.
The whole read renders as a shareable tearsheet — the verdict
banner, the metric strip, and the edge panels. A backtester would stop here; crucible
treats HELD on the pooled log as necessary, not sufficient.
Holdout
A stricter bar: fit on an early slice, confirm on a later one the analysis never touched, with a leakage-controlled split (a trade must have entered and exited before the split, and an embargo band drops the first weeks of the test period).
HOLDOUT @ 2016-01-01 (embargo 8w)
  TRAIN  n=77   E=+0.545R  CI[+0.182,+0.909]  [HELD]
  TEST   n=84   E=+0.500R  CI[+0.125,+0.875]  [HELD]   ← the honest read
The TEST half is the verdict — the TRAIN half should look good, that's where an edge
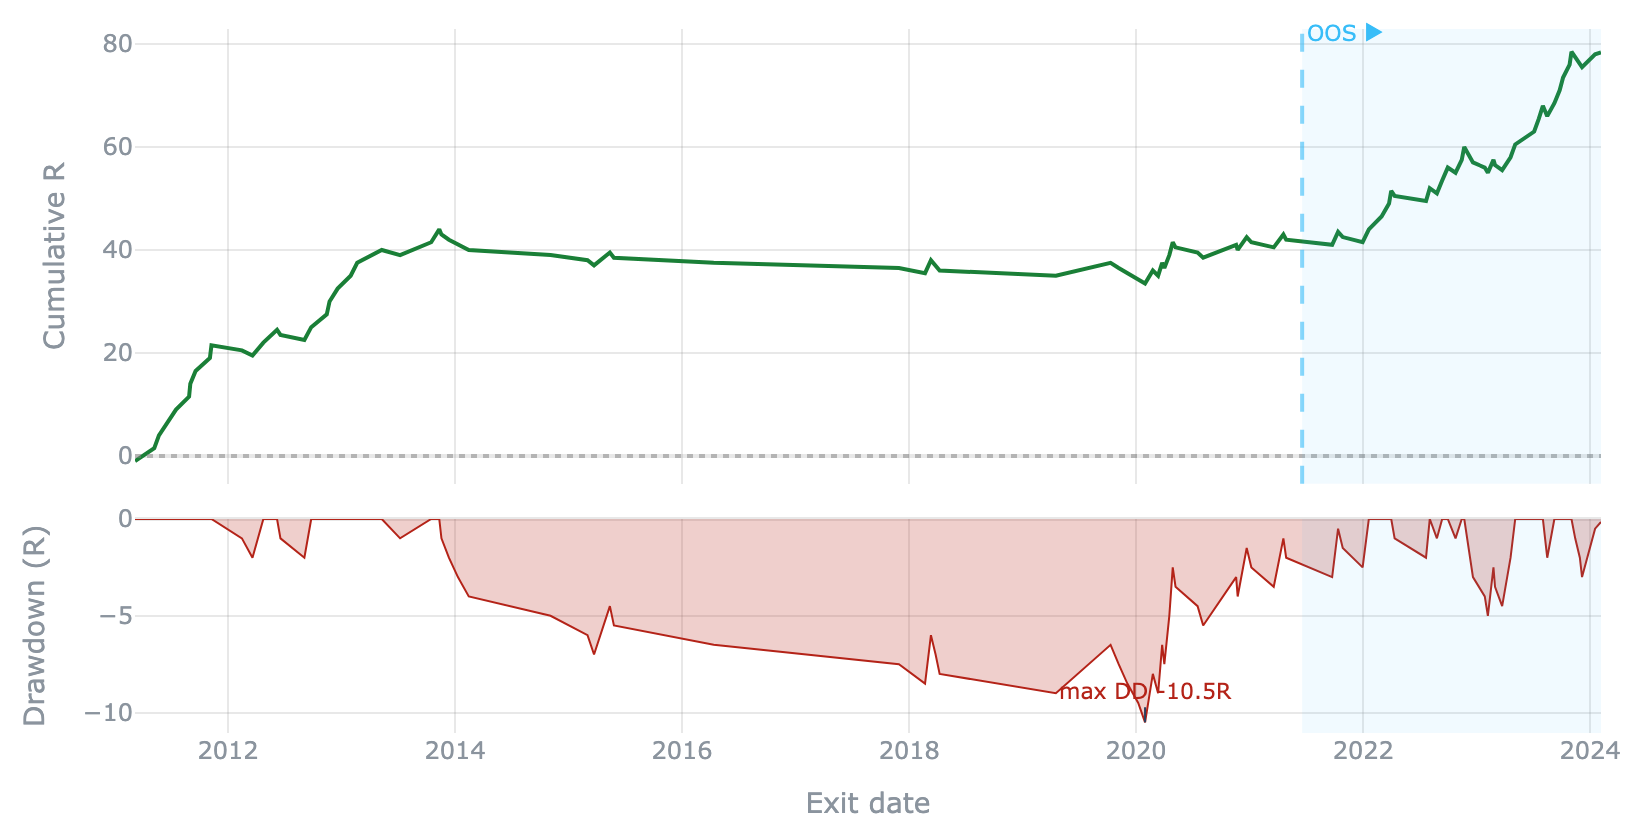
would have been chosen. Plot it with equity_drawdown(trades, test_start=…),
which shades the out-of-sample span:
By segment
A pooled verdict can hide a book that lives in one corner. These two run the same split and windows sliced by a grouping column — asset class, symbol, side. They need a book with segments, so the examples here use a small pooled book across three asset classes (the single-symbol Donchian run has nothing to slice).
segmented_holdout runs the holdout overall and per segment, so a slice that fails
can't hide inside a passing pool:
SEGMENTED HOLDOUT @ 2018-01-01 by 'asset_class' (embargo 8w)
  OVERALL  n=223  E=+0.068R  CI[-0.072,+0.205]  [FRAGILE]
  Energy   n=56   E=-0.225R  CI[-0.475,+0.029]  [FAIL]      ← dragging the pool
  Equities n=77   E=+0.143R  CI[-0.085,+0.361]  [FRAGILE]
  Metals   n=90   E=+0.186R  CI[-0.020,+0.397]  [FRAGILE]
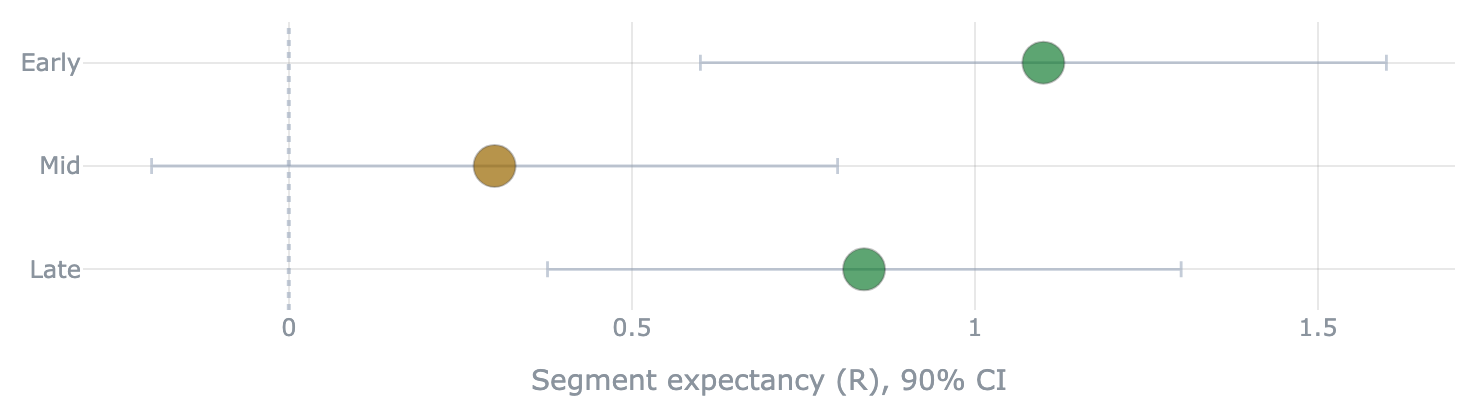
Feed its per-segment stats straight to segment_forest —
one CI whisker per segment, colored by verdict, so a fragile slice is obvious at a glance:
windowed_segments answers when instead of which — a (segment × era) grid of the
metric, no re-fit, showing whether the edge was steady or lived in one window:
WINDOWED SEGMENTS by 'asset_class' (4y windows, metric=expectancy)
             2012-2016   2016-2020   2020-2024
OVERALL     +0.21(195)  +0.05(194)  +0.15(140)
Energy      +0.21(55)   -0.53(45)   -0.12(41)    ← the edge died here
Equities    +0.27(79)   +0.20(65)   +0.27(48)
Metals      +0.14(61)   +0.24(84)   +0.26(51)
Walk-forward
Re-optimize the parameters on each in-sample window, apply the winner to the next unseen period, and stitch the out-of-sample slices into one honest log. This is what catches a strategy that only looks good because its parameters were chosen with hindsight.
The stitched log (wf.stitched) is itself a TradeLog — read it with any mode above.
Its real value is as the input to the gauntlet's DURABLE gate.
Gauntlet
The full bar. run_gauntlet runs the ordered gates — REAL / STRONG / DURABLE /
GENERAL — and returns the deployable verdict. DURABLE applies the walk-forward check the
lighter modes never do.
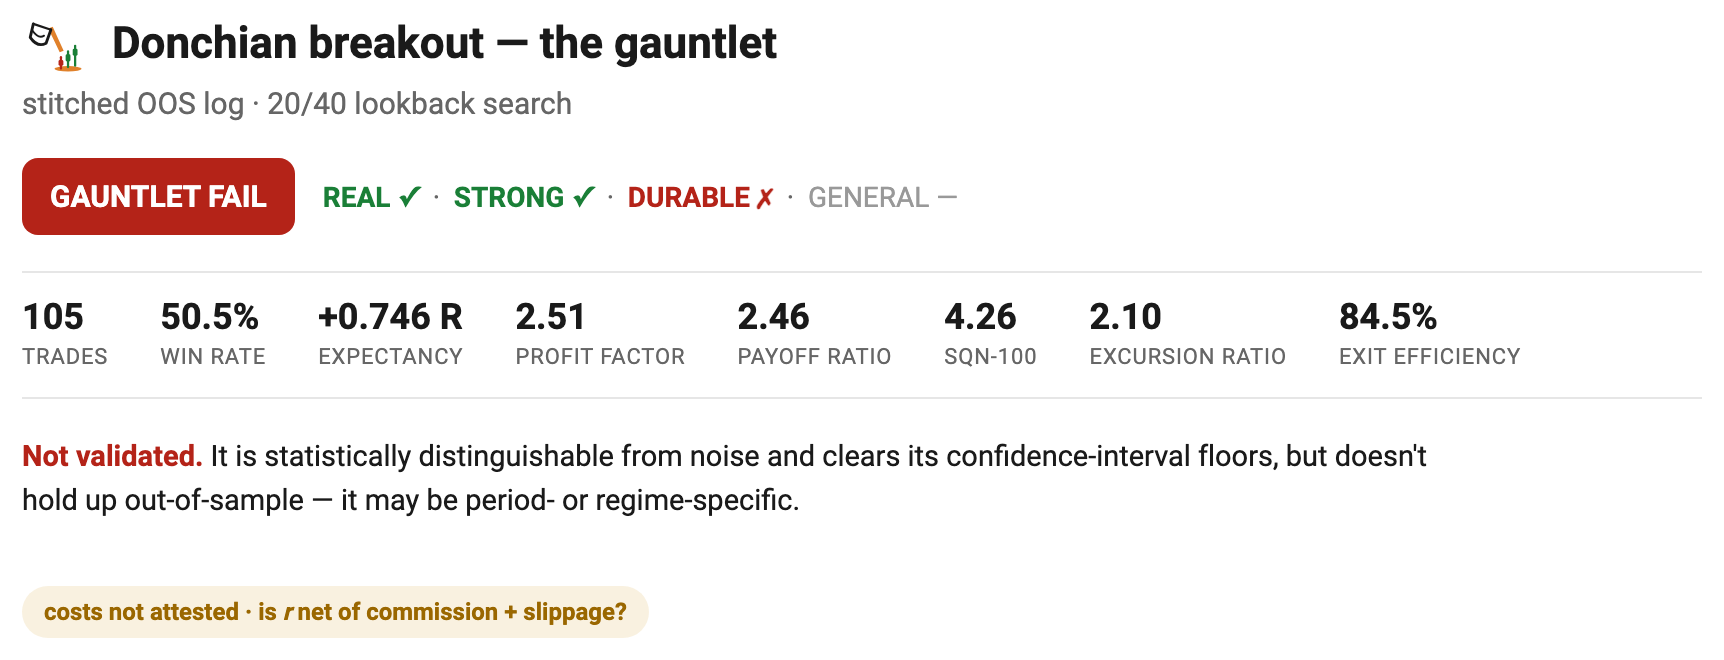
On this Donchian run, REAL and STRONG pass — it isn't noise and it clears every metric at its pessimistic CI lower bound — but DURABLE fails: the walk-forward efficiency runs too hot (out-of-sample outran in-sample, inflated by a few outlier years), the opposite of the graceful degradation a robust edge shows. The cheap modes all said HELD; only the gauntlet catches it. See The gauntlet for the full design.
The ladder is the diagnosis
Where a book drops out tells you why: fails Full sample → no edge even in sample; passes that but fails Holdout → it was a one-era fluke; passes both but fails DURABLE → it only worked with hindsight. A genuine edge clears every rung.